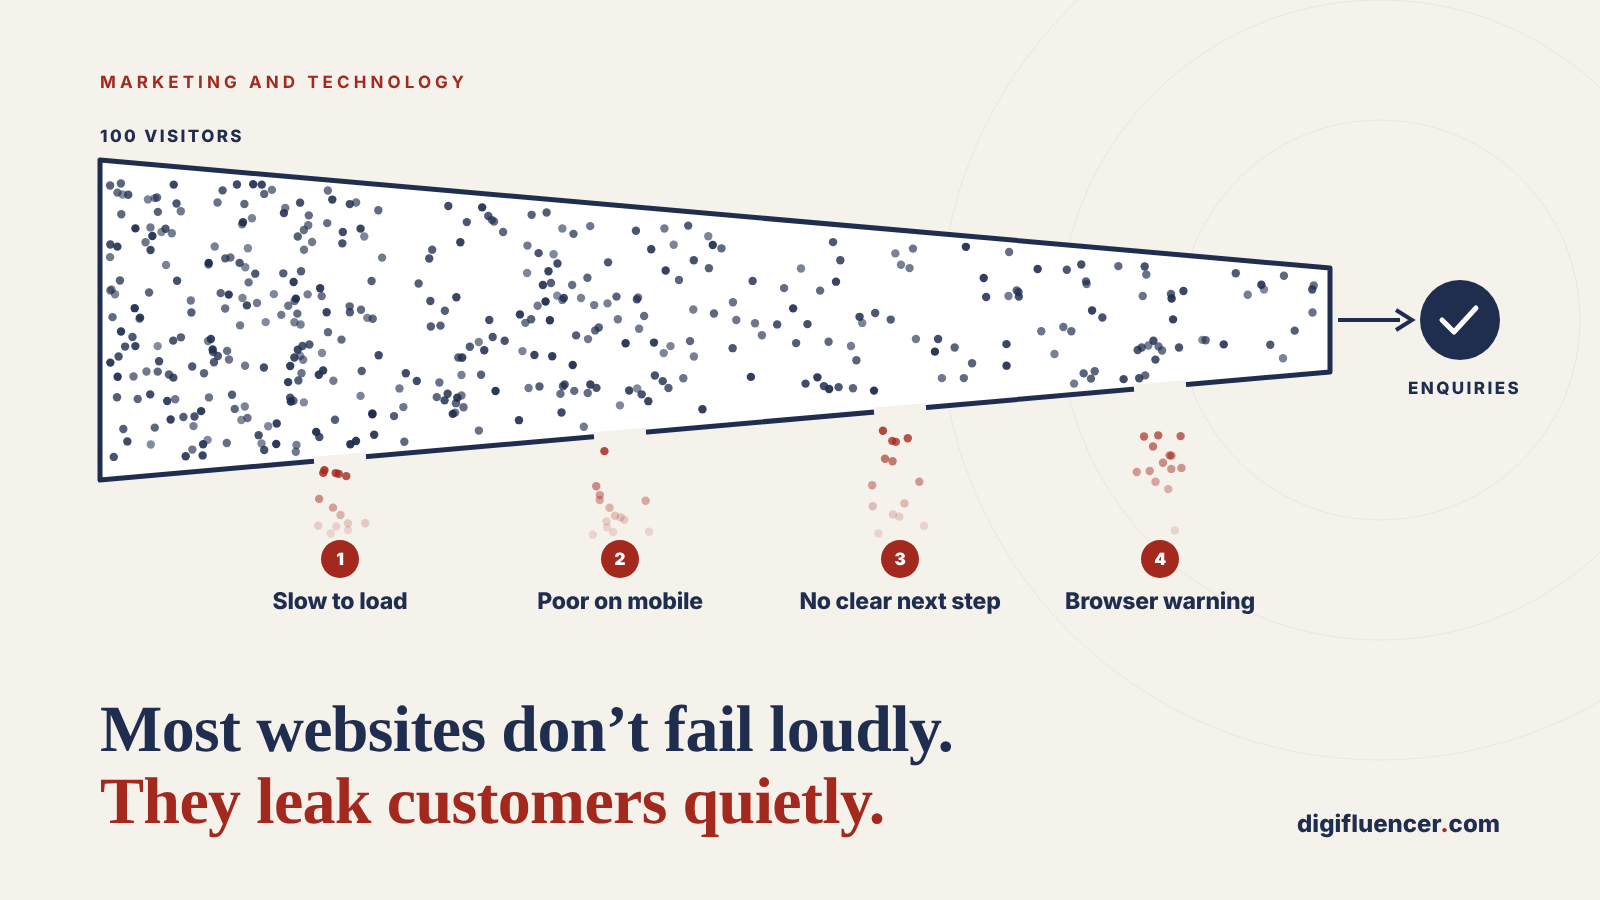
Most websites do not fail loudly. They do not go offline or make headlines. They simply let a share of every month’s prospects leave without a word, and the loss never shows up as a line on the P&L. A practical guide for founders, managing directors and marketing leaders who suspect their website should be doing more.
At a glance
- The most expensive website problems are invisible to the owner. A visitor who leaves a slow page, cannot find a phone number or sees a browser warning does not complain. They go to a competitor, and the business never learns they existed.
- Small frictions carry large costs. Research commissioned by Google and conducted by Deloitte found that a 0.1-second improvement in mobile speed lifted retail conversions by 8.4% and travel conversions by 10.1% (web.dev). Yet only 48% of mobile websites meet Google’s Core Web Vitals standard (HTTP Archive, 2025).
- Buyers now decide before they call. 61% of B2B buyers prefer a buying experience with no sales representative at all (Gartner, 2025). For most businesses, the website is the sales conversation.
- Our guidance: we set out seven signs that a website is leaking customers, a 20-minute self-assessment any leader can run with free tools, and a practical order in which to fix what it finds.
The leak nobody reports
Consider a professional services firm whose website, by every measure the team watched, was performing well. Traffic was steady. The design had been refreshed three years earlier. The agency’s monthly report was green.
Its enquiries, however, had fallen by around a quarter over eighteen months. The team assumed the market had cooled.
It had not. When the site was tested on a mid-range phone over a typical mobile connection, the homepage took more than six seconds to become usable. The contact form had eleven fields, two of them mandatory and irrelevant. The services pages described capabilities in the firm’s internal language rather than the problems clients searched for. None of this was broken. All of it was costing business.
This scenario is a composite, but each element of it reflects issues that are common across small and mid-sized business websites. The pattern is common because of a simple asymmetry: a website’s successes are measured, but its failures are silent. Analytics records the visitors who arrive. It says very little about the ones who leave in frustration, and nothing about the prospects who never found the site at all.
The seven signs below are the ones we see most often. Each is cheap to check and, in most cases, practical to fix.
Sign 1: It is slow, especially on a phone
Speed is the most underestimated driver of website revenue, because the people it turns away leave before they can be counted.
Google’s research found that 53% of mobile visits are abandoned if a page takes longer than three seconds to load (Google, via Marketing Dive). The later Deloitte study, Milliseconds Make Millions, showed how sensitive revenue is to even marginal gains: a 0.1-second improvement in mobile speed raised retail conversions by 8.4%, travel conversions by 10.1%, and the share of lead-generation visitors reaching the form submission page by 21.6% (web.dev).
Most sites are not there yet. In 2025, only 48% of mobile websites delivered a good experience against all three of Google’s Core Web Vitals, compared with 56% on desktop (HTTP Archive Web Almanac, 2025). Because Google uses these signals in its ranking systems, a slow site loses visitors twice: once in search results and again on arrival.
What to look for: a homepage that takes more than three seconds to become usable on a phone; images that load late and push content around; a “Core Web Vitals” report in Google Search Console flagged as “poor” or “needs improvement”.
Why it happens: oversized images, accumulated plugins and tracking scripts, ageing hosting, and themes built for appearance rather than performance.
Sign 2: It was designed for a desk, but used on a phone
In September 2026, 59% of global web traffic came from mobile devices, against 39% from desktop (Statcounter). For many consumer-facing businesses the mobile share is considerably higher.
Yet many websites are still designed, reviewed and signed off on a large monitor in a meeting room. “Responsive” too often means that the desktop layout has been squeezed onto a smaller screen, not that the experience has been designed for someone using one thumb, on the move, with limited patience.
What to look for: text that needs zooming to read; buttons that are too small or too close together; menus that hide the services a visitor came for; forms that are painful to complete on a phone; a phone number that cannot be tapped to call.
The test that matters: ask someone outside the business to find a specific service and make an enquiry using only their phone. Watch, do not help, and time it.
Sign 3: Visitors cannot tell what you do, or why it matters to them
A visitor arriving on a homepage is asking three questions within the first few seconds: Is this for someone like me? Can they solve my problem? Why should I trust them? If the page does not answer all three quickly, the visitor’s next action is the back button.
The most common failure is not poor design. It is copy written from the inside out: a headline that states the company’s vision, a list of capabilities in industry shorthand, and the benefits to the client left for the reader to infer.
This matters more than ever because buyers increasingly make up their minds before contacting anyone. Gartner found that 61% of B2B buyers prefer a rep-free buying experience, and that 69% have encountered inconsistencies between what a supplier’s website says and what its sellers tell them (Gartner, via Mi-3). If the website does not make the case, there may be no second chance to make it in person.
What to look for: a headline that would fit any competitor; services described as what you do rather than what the client gets; no visible proof, such as client names, case studies, results or credentials, on the pages where decisions are made.
The five-second test: show the homepage to someone unfamiliar with the business for five seconds, then ask them what the company does and who it is for. If they cannot say, neither can your prospects.
(For a fuller treatment of positioning and proof on professional services sites, see our guide to building a website for a consulting business.)
Sign 4: There is no obvious next step
Many websites do a reasonable job of explaining the business, and then leave the visitor with nowhere to go. The only call to action is a “Contact us” link in the footer. The form asks for a budget, a company size and a project description before the visitor is ready to share any of them. There is no option for someone who is interested but not yet ready to talk.
Every page should answer the question what should I do now?, and offer more than one answer for visitors at different stages:
| Visitor stage | What they need | Typical next step |
|---|---|---|
| Exploring | To understand the problem and whether you understand it | A useful guide, article or checklist |
| Evaluating | Evidence that you can deliver | Case studies, pricing guidance, a short assessment |
| Ready | A low-friction way to start | A short form, a booking link, a direct phone number |
What to look for: pages with no call to action above the fold; a single, generic “Contact us”; forms longer than they need to be; no confirmation of what happens after someone submits an enquiry, or how quickly.
Why it matters: in the Deloitte study, the measurable gain for lead-generation sites came from more visitors progressing towards the form (web.dev). Lead generation is a journey, and every unnecessary step loses part of the audience.
Sign 5: Prospects cannot find you when they search
A website that converts well but is never found is a shop on a street nobody walks down. If the business does not appear when prospects search for the problems it solves, competitors win those clients by default, often before the prospect knows the business exists.
The landscape is also shifting. Search now includes AI-generated answers alongside traditional results, and those systems favour content that is clear, specific, well structured and demonstrably expert. Thin service pages and a blog last updated two years ago rarely qualify.
What to look for: organic traffic flat or falling over twelve months; the business absent from the first page for its core services and location; Google Search Console showing impressions but very few clicks; no content that answers the questions prospects actually ask.
Where to start: our complete guide to SEO sets out the four pillars of search visibility and how to prioritise them.
Sign 6: Browsers warn visitors before they arrive
Few things end a buying journey faster than a browser telling a prospect that a website is not safe.
This sign has just become more urgent. With Chrome 154, released in October 2026, Google’s browser now turns on “Always Use Secure Connections” by default for public websites. Visitors attempting to open a site that does not use HTTPS are shown a warning and asked whether they want to continue (PPC Land). Most will not.
Missing HTTPS is only the most visible case. Expired security certificates, mixed content, malware flags and “This site may be hacked” labels in search results all have the same effect: they turn a marketing asset into a deterrent. And because attackers often hide their changes from site owners, the business may be the last to know.
What to look for: a padlock missing, or a “Not secure” label, in the browser address bar on any page; certificate expiry warnings; security notices in Google Search Console; unexplained drops in traffic or spikes in spam enquiries.
Go deeper: we explain why a compromise is as much a brand problem as a technical one in Why a Compromised Website Is a Marketing Problem, and set out the essentials in Website Security for Business Owners: 10 Things That Matter.
Sign 7: It looks, reads or works as if nobody is looking after it
Visitors read neglect as a signal about the business itself. A copyright notice from 2022, a news page whose latest post is two years old, team members who have since left, broken links and a design that has visibly aged all raise the same unspoken question: is this company still active, and will it look after me?
Neglect is also frequently invisible to the owner. Analysis of the top one million home pages in February 2026 found detectable accessibility failures on 95.9% of them, with low-contrast text, the single most common issue, present on 83.9% (WebAIM Million 2026, via Nexer Digital). Each of those failures makes the site harder to use for some customers, and in many markets carries regulatory exposure as well.
Underneath the surface, unmaintained software is the most serious form of neglect. Outdated content management systems, plugins and programming languages are among the most common routes into a website, and they tend to degrade speed and stability long before they cause a breach.
What to look for: content that has not been reviewed in more than a year; out-of-date dates, people or offers; broken links or forms; a platform, theme or plugins several versions behind; nobody in the business who can say who is responsible for keeping the site current.
Go deeper: see Website Maintenance Cost: Why Leaders Should Fund Digital Resilience and, for older platforms, Legacy Modernisation Without Disruption.
A 20-minute self-assessment
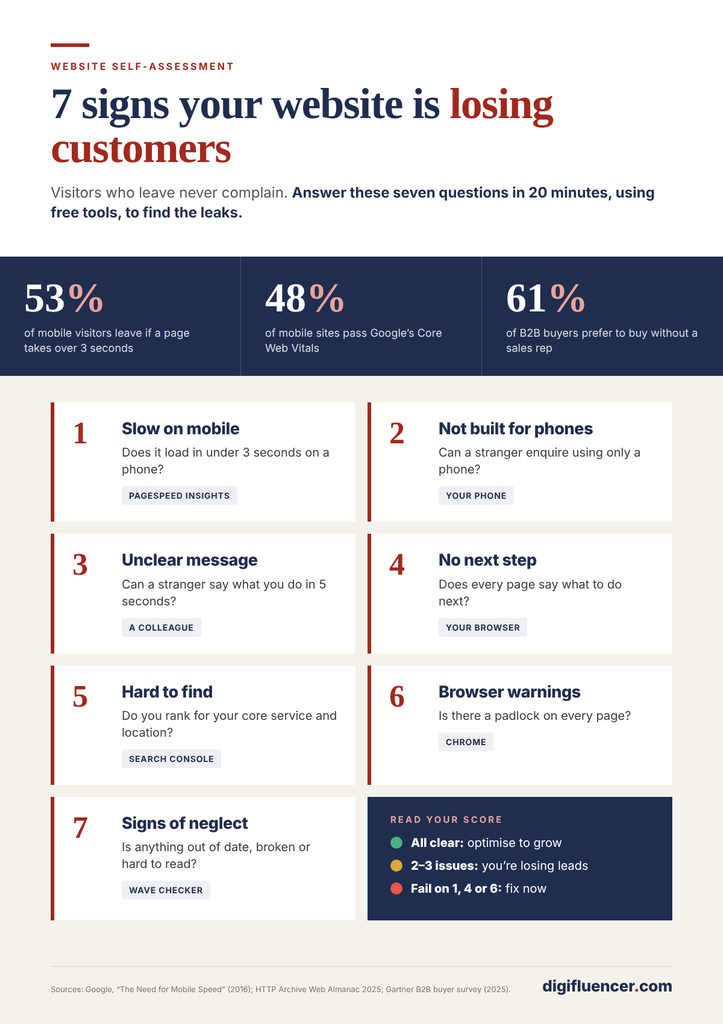
Leaders do not need a technical team to get a first reading on their website. The checks below use free tools and take around 20 minutes in total. Score each sign as green (no issue), amber (some issue) or red (clear issue).
| # | Sign | Quick test | Free tool |
|---|---|---|---|
| 1 | Slow on mobile | Test the homepage and one key service page on mobile | PageSpeed Insights |
| 2 | Poor mobile experience | Ask someone to find a service and enquire, using only a phone | A phone and a stopwatch |
| 3 | Unclear value | Run the five-second test on the homepage with someone outside the business | A colleague or friend |
| 4 | No clear next step | Check every key page for a visible, relevant call to action; count the form fields | Your own browser |
| 5 | Hard to find | Search for your core service and location in a private window; review 12 months of search performance | Google Search, Google Search Console |
| 6 | Security warnings | Check the padlock on several pages; review security issues in Search Console | Chrome, Google Search Console |
| 7 | Signs of neglect | Review dates, team pages, links and the last content update; run an accessibility check | WAVE |
How to read the result:
- Mostly green: the foundations are sound. The opportunity lies in optimisation: testing headlines, calls to action and content to lift conversion further.
- Two or three ambers or reds: the website is very likely losing a meaningful share of prospects. Targeted fixes typically deliver a visible return within a quarter.
- Any red on signs 1, 4 or 6, or four or more reds overall: treat the website as a commercial priority. These issues affect every visitor, every day, and the cost compounds.
What to fix first
Not every issue deserves equal urgency. We recommend leaders sequence improvements by the share of visitors affected and the speed of return.
- Remove the deterrents. Resolve security warnings and anything broken first. These stop journeys outright, and the fixes are usually quick.
- Clear the path to enquiry. Add relevant calls to action, shorten forms and make contact details visible and tappable on every page. This is often the fastest measurable gain.
- Fix speed and mobile together. Image optimisation, script clean-up and hosting improvements typically benefit both, and improve search performance as a by-product.
- Sharpen the message. Rewrite the homepage and key service pages from the client’s perspective, and put proof where decisions are made.
- Build visibility and keep the site current. Search visibility, content and maintenance compound over time. They work best once the site converts the visitors it already has.
The underlying principle is simple: fix the conversion leaks before paying to bring in more traffic. Additional advertising sent to a site that loses half its visitors buys twice as much disappointment.
Frequently asked questions
Our traffic is stable. Doesn’t that mean the website is working?
Not necessarily. Traffic measures arrivals, not outcomes. The more useful measures are the share of visitors who take a meaningful next step, the number and quality of enquiries, and how both trend over time. Stable traffic with falling enquiries is one of the clearest signs of a leak.
Do we need a complete redesign?
Usually not. In our experience, most of the commercial gains come from targeted improvements to speed, messaging, calls to action and security. A redesign is justified when the platform itself is outdated or unmaintainable, or when the business has changed so much that the site no longer represents it.
How quickly can we expect results?
Fixes to security warnings, calls to action and forms can show results within weeks. Speed improvements are typically reflected in user behaviour immediately and in search performance over the following months. Content and search visibility gains build over two to three quarters.
We are a small business. Does this apply to us?
Yes, and arguably more so. Smaller businesses depend more heavily on a small number of enquiries each month, so losing even a few prospects to avoidable friction has a proportionally larger effect.
Who should own the website’s performance?
A named person at leadership level should be accountable for the website as a commercial asset, with clear responsibilities for content, technology and security beneath them. Where ownership is shared by everyone, in practice it belongs to no one.
Conclusion: the website is the first meeting
For most prospects today, the website is not a brochure they read after meeting the business. It is the first meeting, and often the deciding one. A website that is slow, unclear, insecure or neglected does not merely miss opportunities. It quietly hands them to competitors, month after month, without anyone in the business seeing it happen.
The good news is that these problems are visible to anyone who knows where to look, and most of them can be fixed without starting again. The first step is simply to look.
Digifluencer helps organisations turn their websites into dependable sources of growth. Our design, growth and engineering teams, supported by our Safe Web service, work together to find where a website is losing customers and fix what matters most first.
If the self-assessment raised more ambers and reds than you would like, our Website Health Check reviews your site against all seven signs, benchmarks it against competitors and gives you a prioritised, costed action plan. There is no obligation, and you keep the findings whatever you decide.
Request your Website Health Check →
Sources
- Google, 55 and Deloitte, “Milliseconds Make Millions,” published on web.dev, updated June 2020. https://web.dev/case-studies/milliseconds-make-millions
- Google (DoubleClick), “The Need for Mobile Speed,” as reported by Marketing Dive, September 2016. https://www.marketingdive.com/news/google-53-of-mobile-users-abandon-sites-that-take-over-3-seconds-to-load/426070/
- HTTP Archive, Web Almanac 2025, Performance chapter. https://almanac.httparchive.org/en/2025/performance
- Statcounter Global Stats, “Desktop vs Mobile vs Tablet Market Share Worldwide,” September 2026. https://gs.statcounter.com/platform-market-share/desktop-mobile-tablet
- Gartner, sales survey of 632 B2B buyers, conducted August to September 2024, published June 2025, as reported by Mi-3. https://www.mi-3.com.au/04-07-2025/gartner-survey-reveals-b2b-buyers-preference-rep-free-experience
- PPC Land, “Chrome enforces secure connections by default in October 2026.” https://ppc.land/chrome-enforces-secure-connections-by-default-in-october-2026/
- WebAIM, The WebAIM Million 2026, as summarised by Nexer Digital. https://nexerdigital.com/news-and-thoughts/the-webaim-million-report-2026-what-it-tells-us/